
Know What You Will Get, Know What to Build
Listen to this article (experimental) · 11:34

Somewhere above every engineering team there is a person who needs one number: will this land by the end of the quarter? And the machinery that produces that number is remarkable. The person asks a lead. On a good week the lead already knows. On the rest, two developers are interrupted mid-work to produce a polite guess. Either way, the answer gets rounded up on its way through each layer, because nobody wants to carry bad news, and what arrives at the top is a feeling wearing a percentage. Three weeks later the date slips and everyone acts surprised.
Everyone in that chain loses something. The lead becomes a status router instead of the person who clears obstacles, and even the lead who knows is reporting a memory, not a measurement. The developers, when the question does reach them, pay with an afternoon for a report that will be wrong by Friday. The person who asked still does not have a number they can act on, because "we think it is on track" is not a number.
I think the fix is a working method, and I built the tool that runs it. The goal is not fewer questions but both sides finally looking at the same thing: the business knowing, at any moment, how likely it is to get what it asked for, and the developers knowing, from day one, exactly what they need to build and how it will be judged.
Where the method comes from
The first piece comes from how the best OKR teams already work. In the Radical Focus style, every key result starts the quarter at a confidence of five out of ten, and the weekly check-in nudges that confidence up or down based on what actually happened. Google grades OKRs from 0.0 to 1.0 at quarter end. That ritual treats a key result's status as a probability, revised weekly, not a list of activities.
The second piece comes from the forecasting research. The best forecasters differ from everyone else in behavior, not intelligence or inside knowledge: they update frequently and in small steps, and they anchor on base rates, what usually happens, before touching what feels different this time. Frequent small updates over a base rate is, almost word for word, the OKR weekly check-in done right.
Put those side by side: the weekly check-in is a forecasting exercise. Teams run it by hand, in a meeting, from memory, and the person holding the marker is usually the most optimistic one in the room. Meanwhile the base rate, the team's real pace, sits in the repository, recorded to the second, and nobody ever asks for it.
The repository tools do not close this gap either. Burndown charts and velocity reports consume the same data, but they live at sprint level, inside the developers' tooling, where the business never looks. They produce charts, not probabilities with reasons attached. And nobody goes back to score a burndown against what actually shipped, so nobody can tell you whether last quarter's chart deserved to be believed.
The framework
The proposal adds no new meetings, though it does demand the issue hygiene most teams claim to have already. It needs one meeting that already exists and one job that runs on its own.
At the start of the quarter, the team leads sit with the business and set the objectives. That part does not change. What changes is what happens next: each objective is broken into key results, and each key result is encoded where the work actually lives, as a GitHub milestone with a deadline, or a labeled slice of one when a milestone carries several. A key result stops being a slogan on a slide and becomes a clickable set of issues.
The GitHub side of this is deliberately boring. A milestone with a due date is one small form:
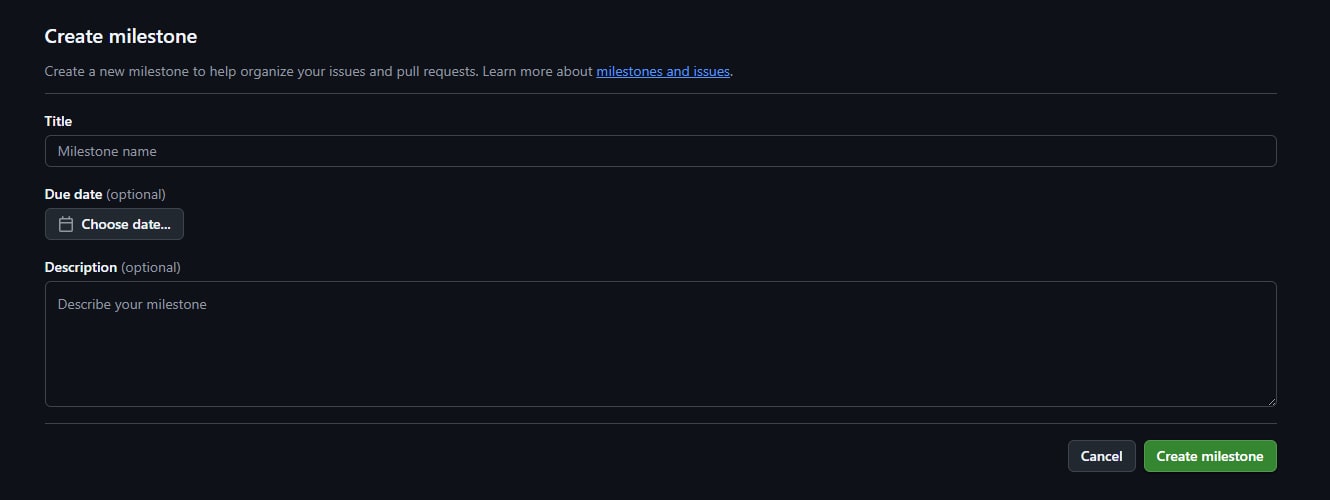
A label per key result is another, sitting next to the ones every repository already has:
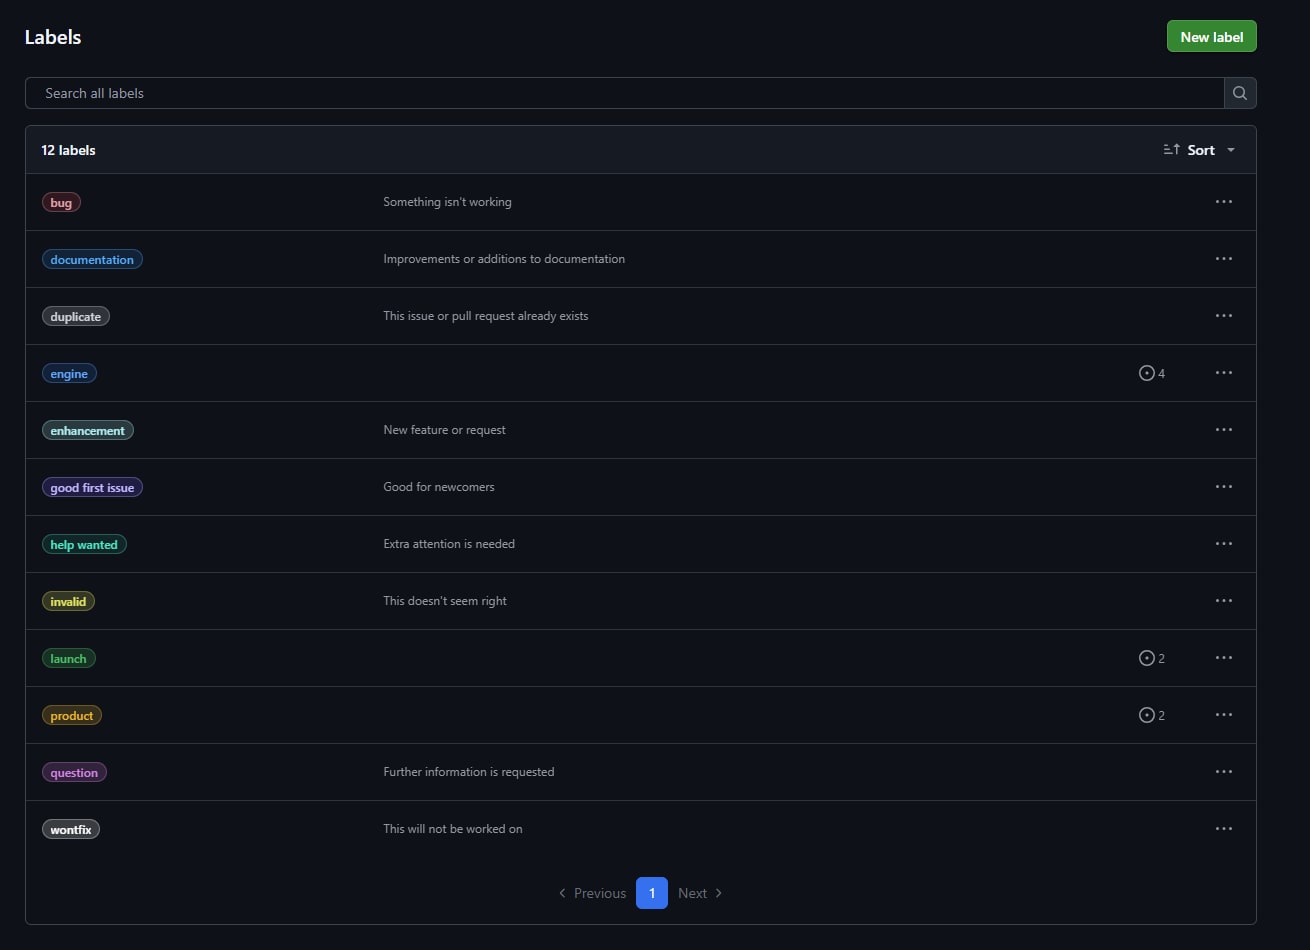
Issues pick up both during normal triage, the milestone and their key result's label. A short config file then tells the forecaster and the dashboard how to read them: which objective owns which milestone, which label slices it into key results, and which issue receives the weekly comment.
repo: tiago-peres/superforecaster
milestones:
  - milestone: v1.0
    objective: Ship Superforecaster v1
    deadline: 2026-08-14
    krs:
      - id: engine
        name: Forecast engine turns a milestone into a calibrated P(delivery)
        label: engine
        tracking_issue: 1
That is the whole setup. Open the milestone afterwards and it already reads like the promise it is: a due date, a progress bar, and every remaining work item carrying its key result's label, visible to anyone who cares to look. Done means these issues, closed, by this date.
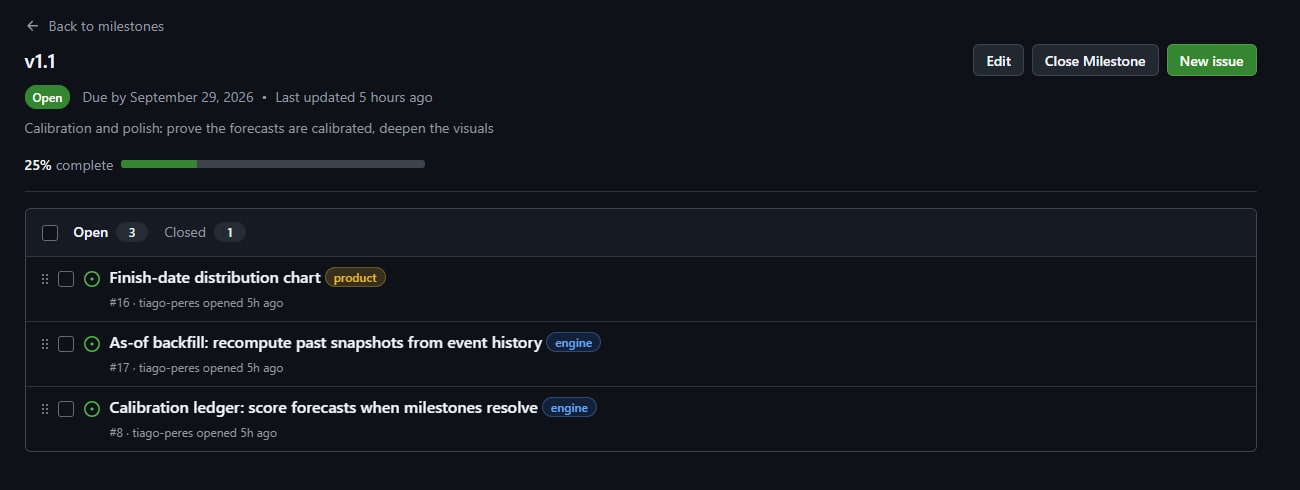
One honest boundary before going further: this covers delivery key results, scope that ships by a date. A metric key result, adoption, revenue, latency, needs the metric itself as its feed, and no amount of issue arithmetic substitutes for it. But the quarter's delivery commitments are where the will-it-ship anxiety lives, and for those, the issues are the work, and the work is what a forecast can watch.
Then, during the quarter, nobody writes status. A job runs every Monday and does what the room was pretending to do. It reads the repository: what closed this week, what got added to scope midweek, the real weekly pace. It replays the rest of the quarter ten thousand times over that pace, Monte Carlo over actual throughput, and reports the fraction of futures that make the deadline. When a repository is too young to have a pace of its own, the forecaster borrows the distribution from the team's previous repository, a deliberately weak prior held only until real history accumulates. And the forecast's sharpness tracks the backlog's decomposition: while half the scope is still epics, the cone is wide, and it should be.
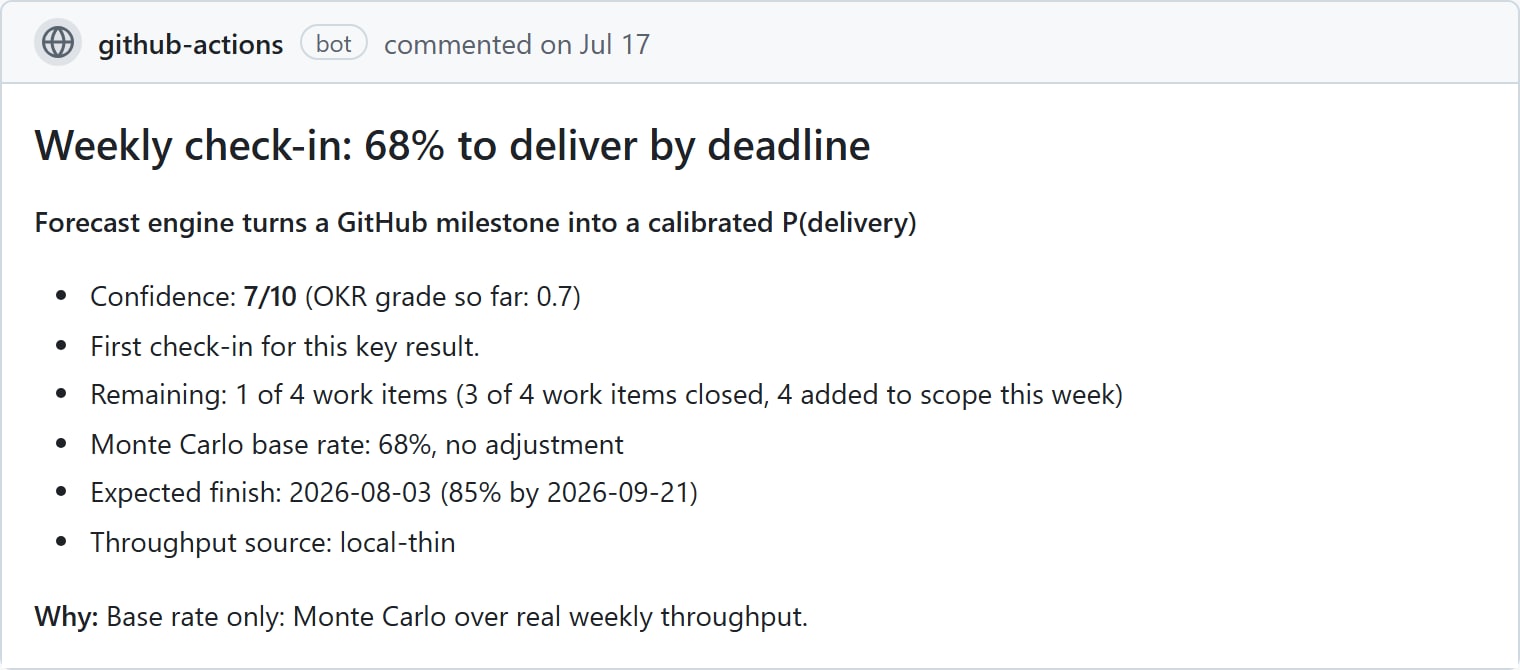
On top of the math, a model reads the open issues the way a reviewer would, looking for the risk the numbers cannot see, the ticket that is really unbounded research, the dependency on a decision nobody has made. It can move the probability by at most fifteen points, its reasoning is published next to the number, and its adjusted forecast is scored separately from the raw one, so the record shows whether the judgment layer earns its keep. Then the job posts one comment per key result on its tracking issue: the probability, how it moved since last week, what moved it, and why.
And the dashboard is where all of it lands, for everyone, at any time.
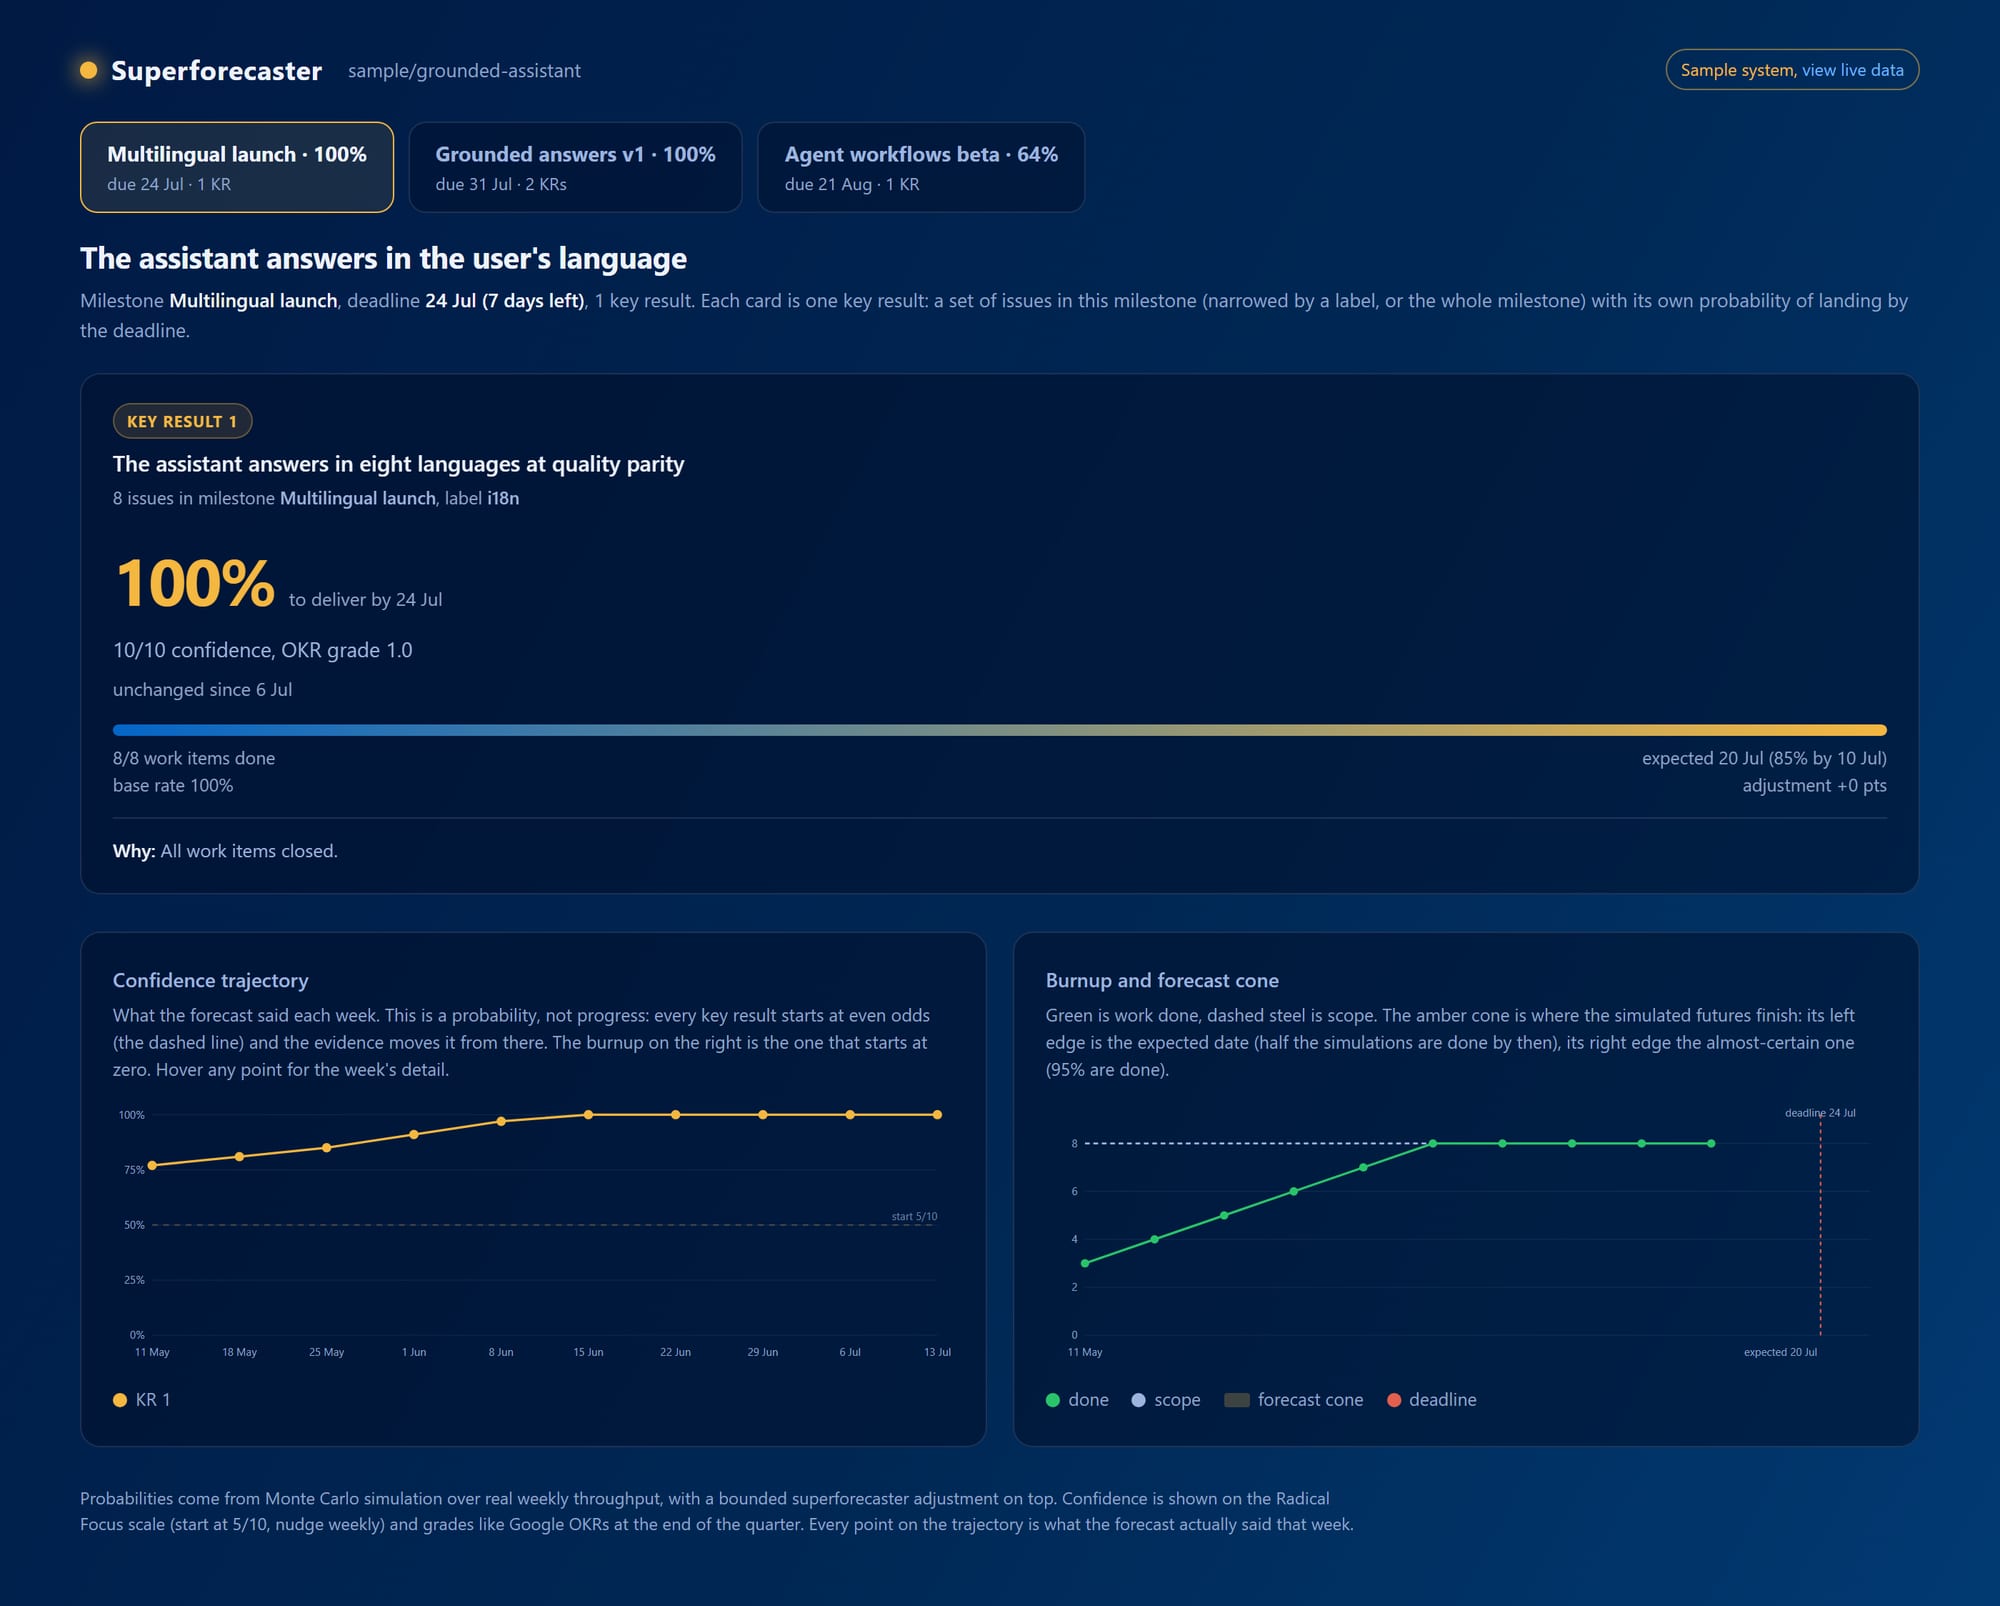
The business checks the dashboard before the steering meeting instead of asking anyone. Each key result shows its probability of landing by its date, the week's movement, the expected finish, and the written reason. The trajectory chart is the OKR confidence line made real: it starts at even odds and every point is what the forecast said that week, not a curve redrawn to look tidy in the retro. At quarter end the 0.0 to 1.0 grade falls out of the history instead of being negotiated in a room.
The view that justifies the whole method is the unhappy one. Here is what a milestone in trouble looks like, from the sample system the dashboard ships with:
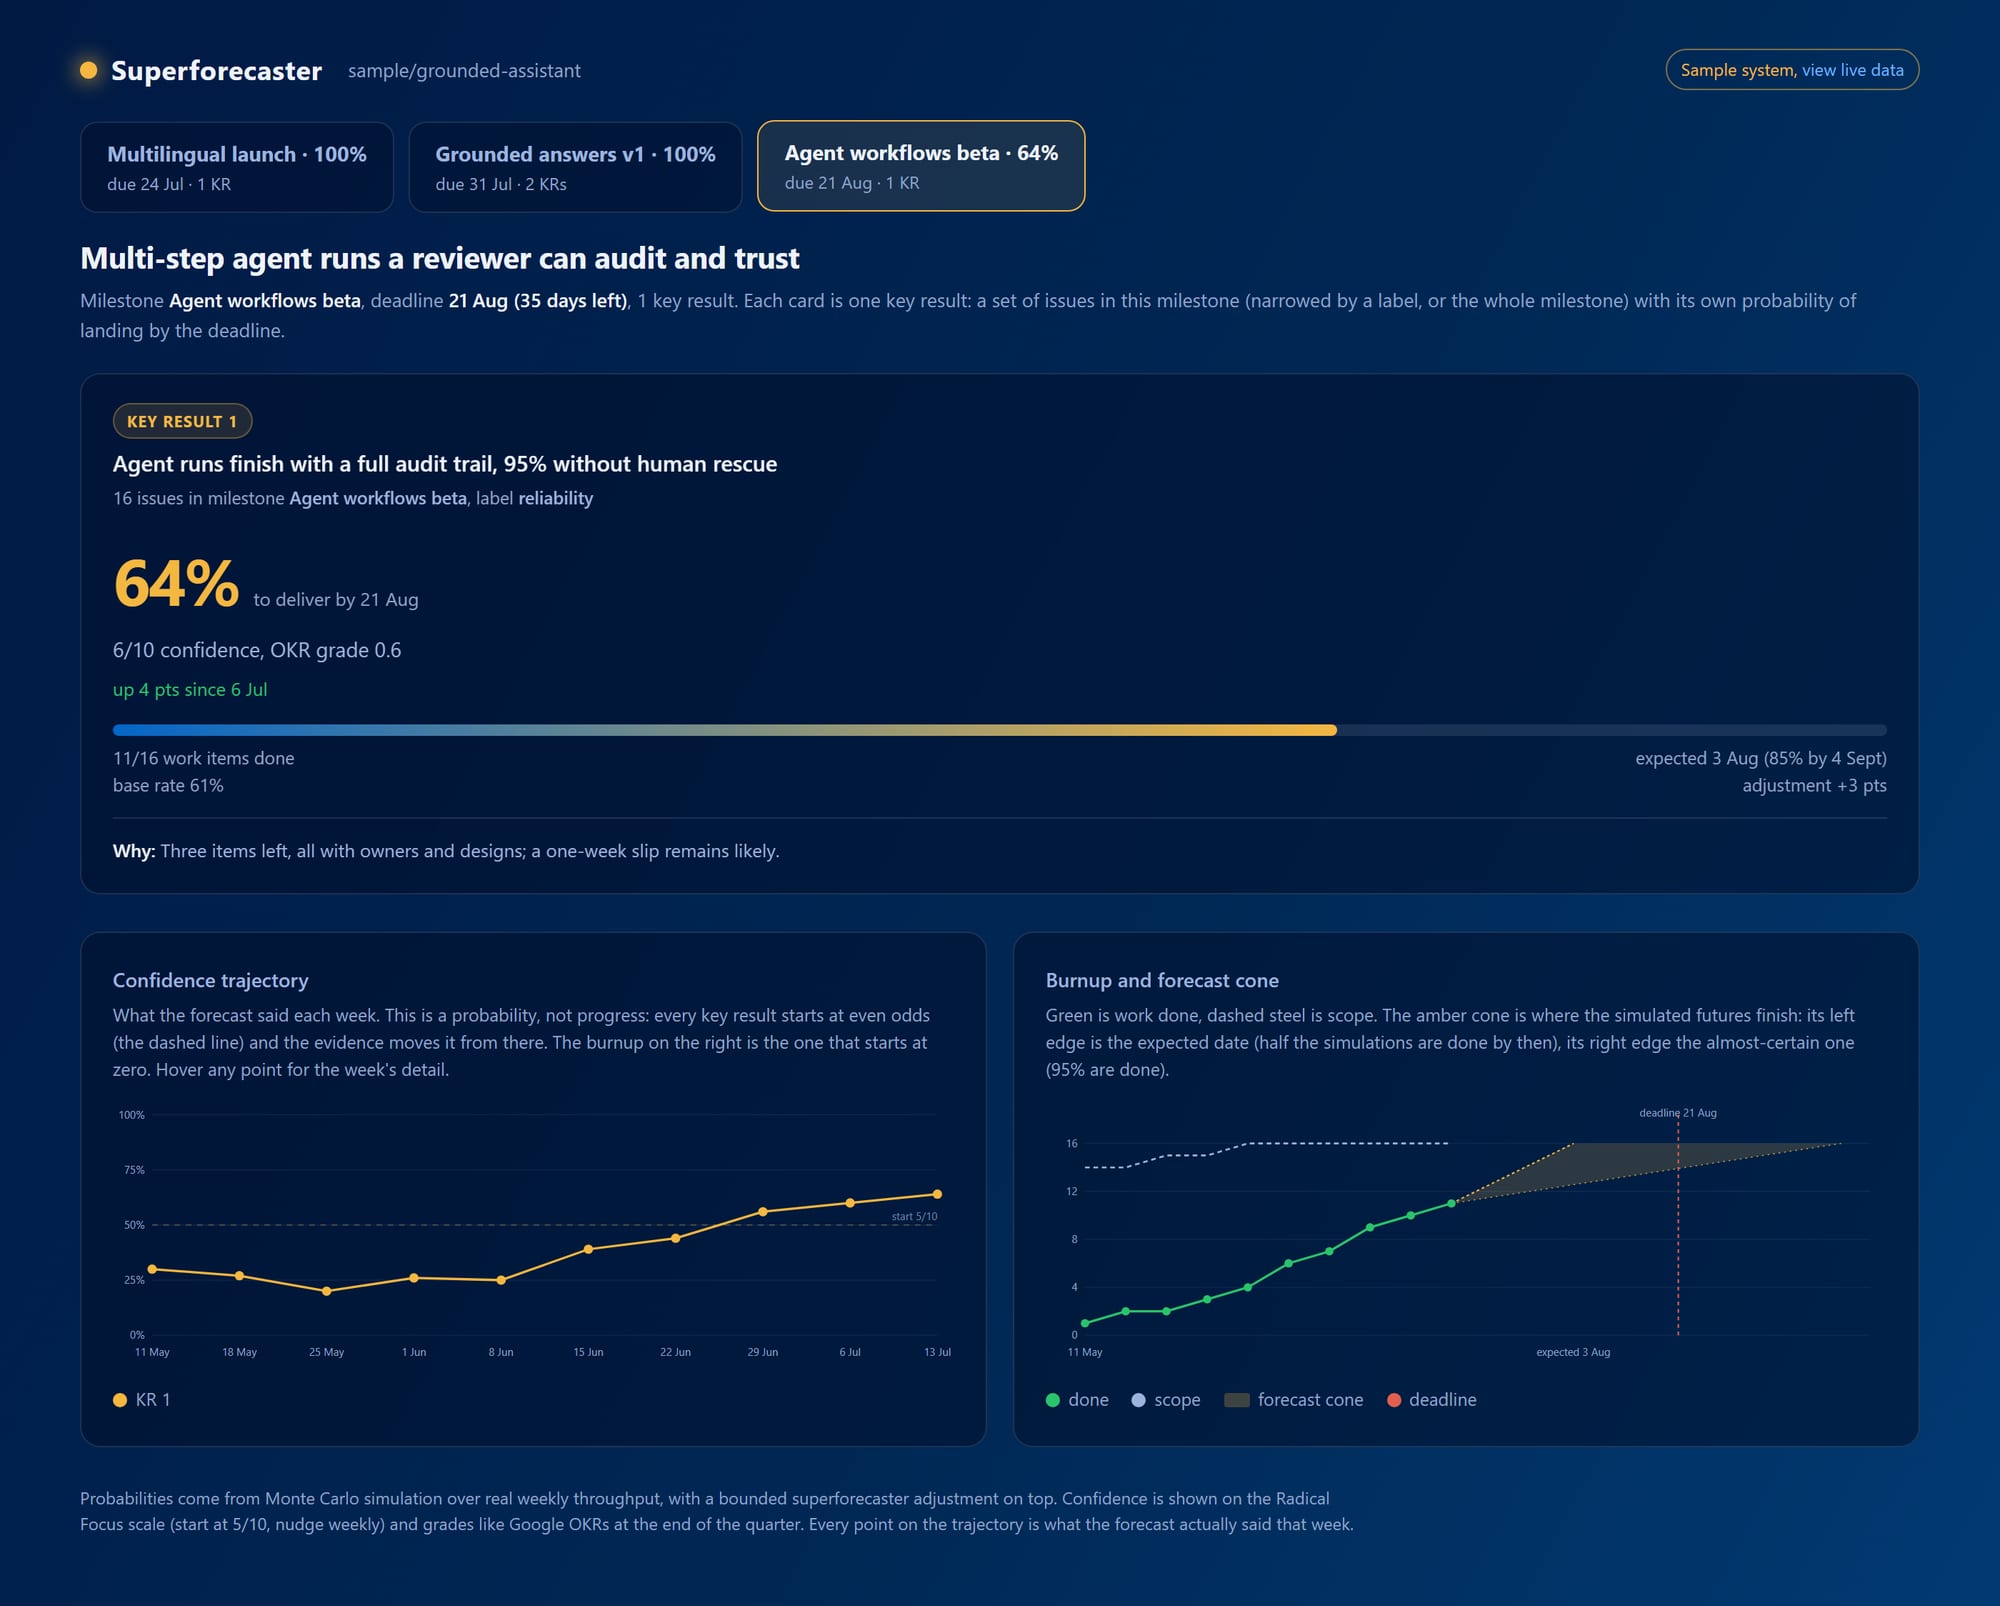
A key result at 64%, visibly in trouble, months before its deadline stops being negotiable. The confidence line spent a month under its starting point while one blocking piece of infrastructure held everything behind it, and the written rationale said so each week. Nobody had to escalate. Nobody had to confess in a meeting. The number went down, the reason was attached, and the team got weeks to act instead of a bad surprise at the deadline.
What the tool taught me on day one
I built this as a product called Superforecaster, and the first team it forecasts is itself: its own milestones, its own issues, its own weekly check-ins posted to its own tracker. Dogfooding taught me a lesson within hours. On its first unsupervised run, it announced a 100% probability, ten out of ten confidence, for a milestone that was four weeks out. The cause was one hot week of closed issues and no variance, which is the oldest sin in forecasting: total certainty from a tiny sample. The fix was to make thin history widen the uncertainty instead of narrowing it, and to lean on the outside view until the repository has a real track record. After the fix, the same data said 35%.
That number was uncomfortable, and it was supposed to be. A vibe would have said "going well." The forecast said: at this pace, with this scope, you probably miss. You can argue with a 35%, cut scope against it, move a date because of it. There is nothing to argue with in "on track." The milestone is still open as I write this, so the record will judge that 35% the way this method judges every forecast: scored against what actually happened. Until then it is a disciplined guess, which is already more than a status meeting ever gave anyone.
What each side gets
The business gets a probability that is consistent from week to week, because the same method produces it every time, with the reason attached. When the answer is bad, it arrives early enough to change the ask while the quarter can still absorb the decision.
The developers get a definition of success that is a link, fixed at the start and visible all quarter, and when it changes, it changes in the same place they work. They also get their week back: the forecast reads their commits and their issues, never their time, and it aggregates at the level of the milestone, so the dashboard carries no per-person numbers to stare at.
The leads get out of the routing business. The check-in writes itself from the repository, so the lead's meeting time goes to the thing the dashboard surfaced, the blocked decision, the scope that grew, instead of to assembling the news.
Where this breaks
A probability is not a promise, and the method is only as good as the hygiene underneath it. If work does not live in issues, the forecaster is blind. If scope changes never touch the milestone, the burnup lies.
There are two ways the numbers can rot, and they need different cures. The forecaster itself can drift, and for that the cure is mechanical: every forecast is written down and scored when the milestone resolves, so the record shows whether it deserves to be believed. The team can also game it, closing hollow issues, splitting tickets to inflate the pace, moving scope out of the milestone with nobody watching, and no scoring catches that. The dashboard can make scope changes and reopened issues visible, but the last line of defense is the one it always was: a review culture where an empty close does not survive. A tool cannot supply that. It can only make the gaming visible.
Interruptions do not drop to zero either. A number that falls nine points on a Monday will draw questions, and it should. What changes is where the questions land and what they carry: they go to the tracking issue, already loaded with the reason, and the conversation starts at "the odds dropped because scope grew, what do we cut?" instead of "where are we?". That is a conversation worth having, with anyone.
The quarter starts with people in a room agreeing on what matters. The machine's job is everything after: it watches the work and does the arithmetic, and it tells everyone the same number at the same time.
Questions this article answers
How can you tell early whether a quarter's work will actually ship on time?
By reading the repository rather than asking people. A job runs every Monday, takes what closed that week and what was added to scope midweek, then replays the rest of the quarter ten thousand times over that real pace and reports the fraction of futures that make the deadline. Thin history has to widen the uncertainty rather than narrow it: on its first unsupervised run the tool announced 100% for a milestone four weeks out, and after that fix the same data said 35%.
How is this different from burndown charts and velocity reports?
Those consume the same data, but they live at sprint level inside the developers' tooling, where the business never looks, and they produce charts rather than probabilities with reasons attached. Nobody goes back to score a burndown against what actually shipped, so nobody can tell you whether last quarter's chart deserved to be believed. Here every forecast is written down and scored when the milestone resolves, and the model layer that reads the open issues can move the number by at most fifteen points, with its reasoning published and its adjustment scored separately from the raw one.
What stops a team from gaming the forecast by closing empty issues?
Nothing in the tool, and that is the boundary worth stating. Scoring catches the forecaster drifting, but it does not catch hollow closes, tickets split to inflate the pace, or scope moved out of the milestone with nobody watching. The dashboard can make scope changes and reopened issues visible; the last line of defense is the one it always was, a review culture where an empty close does not survive.
Does this end up measuring individual developers?
No. The forecast reads commits and issues, never anyone's time, and it aggregates at the level of the milestone, so the dashboard carries no per-person numbers to stare at. What developers get instead is a definition of success that is a link, fixed at the start of the quarter and visible all the way through, and their afternoons back from writing status nobody scores.
Read next
 AI
When the AI Has to Film Its Own Review
When a pull request is raised, mine or one I have to review, I now ask the agent to run it on my machine, try to break it and film itself doing it. A paragraph can claim a test happened. A recording has to show it, and deciding what it means is still my job. AI
Jev Answers in Probabilities. The Question Is Still Yours.
TypeSafe's Jev will not write a sentence. You hand it a state and typed questions, and it hands back a choice, a score or a yes/no probability, at four thousandths of a cent for a decision over a thousand tokens. The novelty is the shape, which puts authority back in your code, and the trap is that a probability looks like recourse and is not. I ran the pilot I would want before believing any number, on my own essays with the open model that stood in for Jev, and the answer was no.